
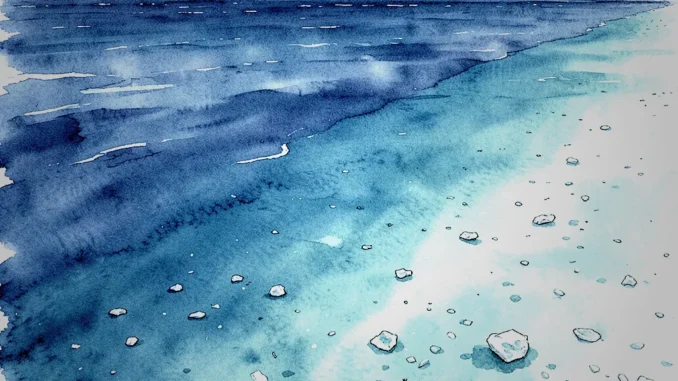
Satellite observations indicate that parts of the North Pacific, including the region associated with the Great Pacific Garbage Patch, have shifted toward lighter blue and green hues over time. Researchers compared three satellite datasets covering 2002–2022 and found a statistically significant change in the ocean’s optical signature. Their analysis suggests that microplastic accumulation may help explain the shift, but satellite color alone cannot confirm that plastics caused it.
What did the satellite study find?
The research team examined changes in satellite-measured ocean color across the North Pacific. They analyzed long-term trends, separated seasonal cycles, and compared the affected region with surrounding areas. The observations showed a persistent shift toward lighter blue and green tones.
Researchers also modeled natural influences, including phytoplankton abundance, organic matter, and iron from melting sources. These factors did not fully account for the observed change. The statistical analysis found that microplastic accumulation was more than four times as likely as the modeled natural explanations to account for the color shift. This is a comparison of explanatory likelihood, not direct evidence that plastics caused the change.
How can microplastics affect ocean colour?
Microplastics can alter how light travels through water. Particles smaller than one millimeter may scatter or reflect light differently depending on their size, concentration, shape, and surface properties. Satellite sensors detect light reflected from the ocean, so changes in particle-related scattering can affect the spectral measurements used to describe ocean colour.
In the study, researchers compared satellite patterns—such as increased backscattering at selected wavelengths and shifts in surface reflectance—with laboratory measurements from plastic-containing samples. The reported similarities support a possible connection, although other substances and processes can also influence the same optical signals.
Why do satellites need to be paired with field sampling?
Satellites cover vast areas and make it possible to track changes over many years, but they cannot identify the exact material responsible for every color signal. Phytoplankton, dissolved organic matter, sediments, and other particles can also change the light reflected from the sea.
To test whether a satellite signal corresponds to microplastic pollution, researchers need to collect water samples at the same locations and times as satellite observations. They can then measure plastic concentrations and compare those results with the satellite’s spectral data. This helps determine whether the two patterns align and whether other explanations remain plausible.
How can researchers validate satellite observations in the field?
- 1. Choose study and control sites. Sample locations where satellite data show a change, along with nearby comparison sites.
- 2. Coordinate sampling with satellite passes. Collect surface water, water-column samples, and plankton at times that closely match satellite observations.
- 3. Separate and identify particles. Use filters with different pore sizes to sort particles by size, then apply microscopy and FTIR spectroscopy to identify plastics.
- 4. Measure optical properties. Record spectral backscattering and absorbance in field or laboratory conditions.
- 5. Combine the datasets. Compare measured microplastic concentrations with satellite band data using statistical models, while accounting for natural variables.
What are the possible effects on marine food webs?
The study cites estimates that around 13 million tons of plastic enter the ocean each year, while roughly 250,000 tons may remain detectable as floating surface debris. These figures describe different aspects of ocean plastic and should not be treated as estimates of the same material or measurement.
Microplastics can occur both at the surface and within the water column. Plankton and small fish may ingest particles, which can then move through food webs when larger animals consume them. The cited research notes that microplastics have been detected in many commercially important fish species. Detection alone does not establish the level of risk to humans, but it makes exposure through seafood an important subject for further study.
What do the reported figures mean?
- Plastic entering the ocean each year: approximately 13 million tons, according to estimates cited by the study.
- Floating debris detectable at the surface: approximately 250,000 tons, as reported in the cited data.
- Relative explanatory likelihood: the analysis found microplastic accumulation more than four times as likely as the modelled natural factors to explain the observed color change.
These figures come from different estimates and methods. They provide context for the scale of pollution and the study’s statistical result, but they do not by themselves measure the amount of microplastic in the satellite-observed region.
How could satellite monitoring support pollution response?
Satellite monitoring can help researchers identify broad areas where ocean optical conditions are changing and track those areas over time. When paired with field measurements, these observations could help locate pollution hotspots and guide decisions about where to conduct further surveys or prioritize cleanup efforts.
Long-term satellite records may also help assess whether measures to reduce plastic leakage coincide with changes in pollution indicators. For decisions such as cleanup planning or fishing restrictions, however, agencies need validated field data and evidence about ecological conditions—not satellite color measurements alone.
What should future research investigate?
Further work can improve confidence in satellite-based plastic monitoring by collecting field samples more frequently, using robotic samplers across larger areas, and building reference libraries of optical signatures for different plastic types and particle sizes. Researchers also need to examine how seasonal changes affect the signal and how microplastics move through marine organisms and food webs.









Be the first to comment